Multivariate tests
Note
In all multivariate 1D tests dependent variables are (J x Q x I) arrays
J = number of 1D responses
Q = number of nodes to which the 1D responses have been resampled
I = number of vector components
Warning
Results become unstable as I approaches J.
These techniques are suitable mainly for J much larger than I.
One-sample Hotelling’s T2 test
Note
We do not yet have any real data examples to show.
>>> T2    = spm1d.stats.hotellings(Y, mu)
>>> T2i   = T2.inference(0.05)
>>> T2i.plot()
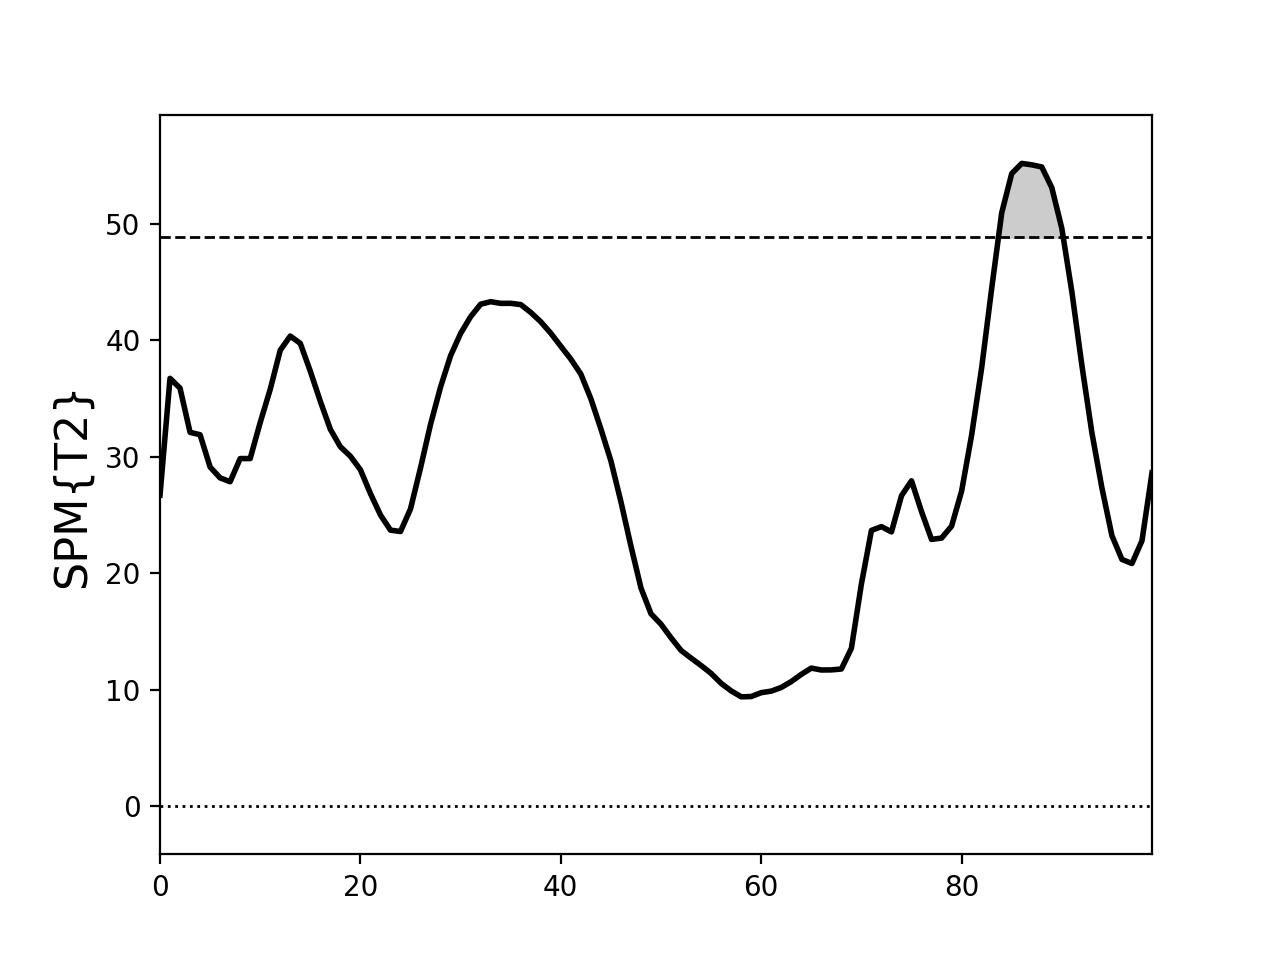
Paired Hotelling’s T2 test
./spm1d/examples/stats1d/ex_hotellings_paired_Pataky2014.py
>>> T2    = spm1d.stats.hotellings_paired(YA, YB)
>>> T2i   = T2.inference(0.05)
>>> T2i.plot()
These results come from:
Pataky, T. C., Robinson, M. A., Vanrenterghem, J., Savage, R., Bates, K. T., & Crompton, R. H. (2014). Vector field statistics for objective center-of-pressure trajectory analysis during gait, with evidence of scalar sensitivity to small coordinate system rotations. Gait and Posture, 1–4. http://doi.org/10.1016/j.gaitpost.2014.01.023
(Source code, png, hires.png, pdf)

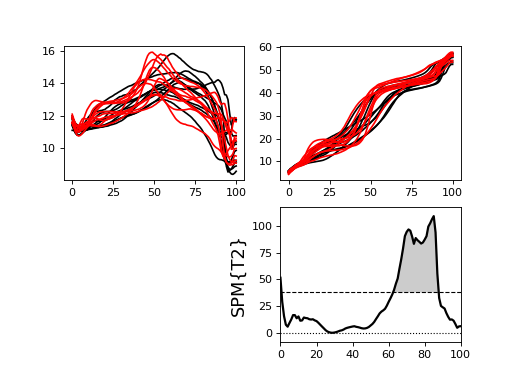
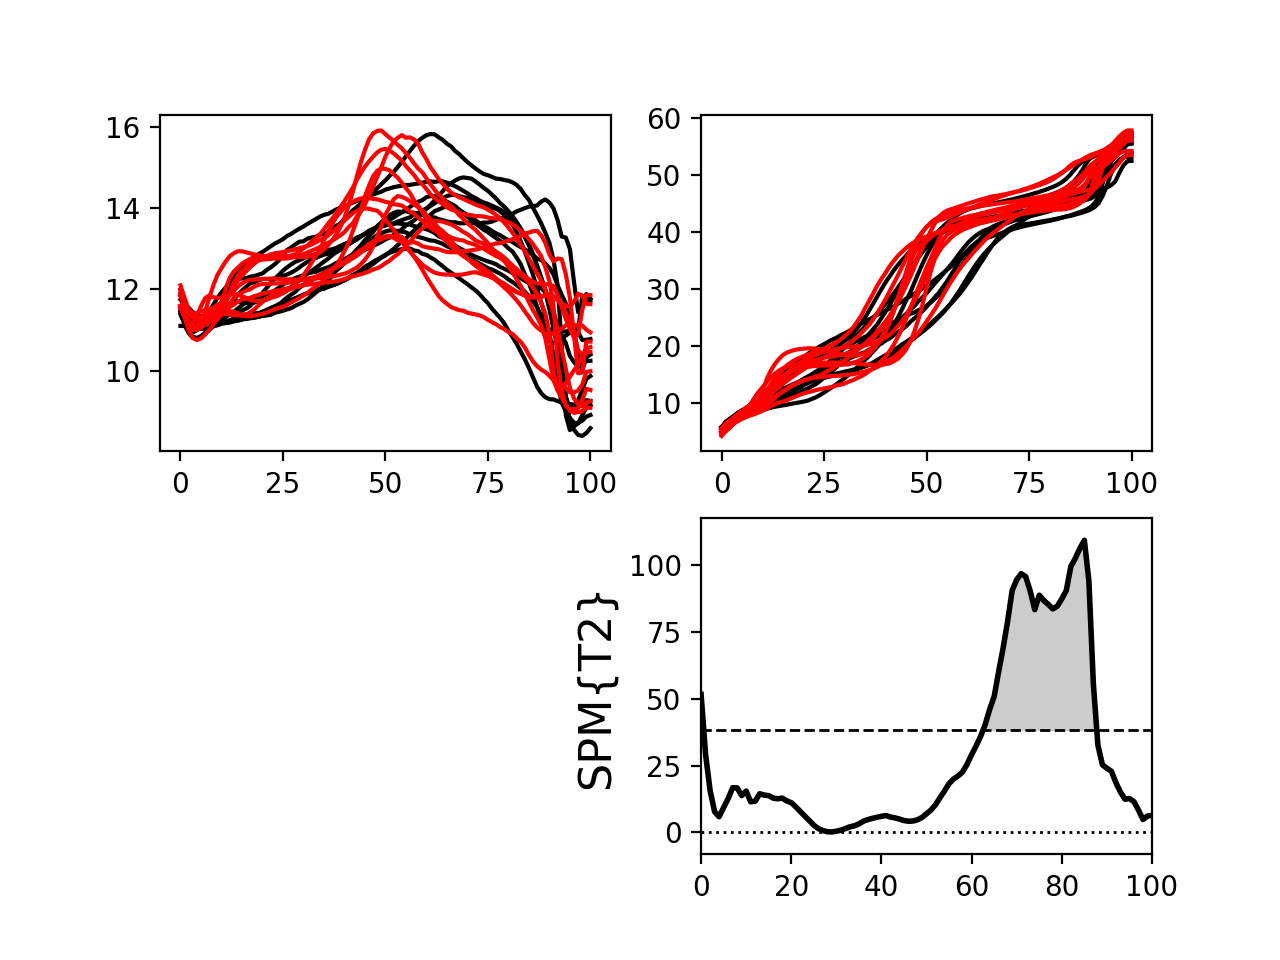
Two-sample Hotelling’s T2 test
./spm1d/examples/stats1d/ex_hotellings2_Besier2009muscleforces.py
>>> T2    = spm1d.stats.hotellings2(YA, YB)
>>> T2i   = T2.inference(0.05)
>>> T2i.plot()
The data in this example come from:
Besier, T. F., Fredericson, M., Gold, G. E., Beaupré, G. S., & Delp, S. L. (2009). Knee muscle forces during walking and running in patellofemoral pain patients and pain-free controls. Journal of Biomechanics, 42(7), 898–905. http://doi.org/10.1016/j.jbiomech.2009.01.032
Results appear in:
Pataky, T., Robinson, M., & Vanrenterghem, J. (2015). Journal of Biomechanics. Journal of Biomechanics, 48(1), 190–192. http://doi.org/10.1016/j.jbiomech.2014.09.025
(Source code, png, hires.png, pdf)

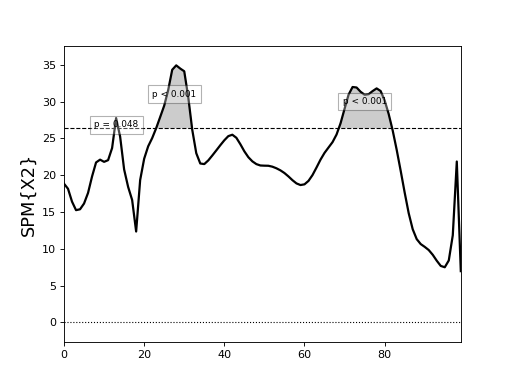
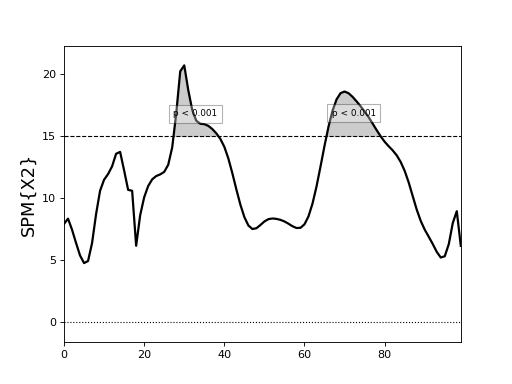
Canonical correlation analysis
./spm1d/examples/stats1d/ex_cca_Dorn2012.py
The second input x must be a Jx1 vector of scalars.
spm1d currently does not support multivariate regressors.
>>> X2   = spm1d.stats.cca(Y, x)
>>> X2i  = X2.inference(0.05)
>>> X2i.plot()
The data in this example come from:
Dorn, T. W., Schache, A. G., & Pandy, M. G. (2012). Muscular strategy shift in human running: dependence of running speed on hip and ankle muscle performance. Journal of Experimental Biology, 215(11), 1944–1956. http://doi.org/10.1242/jeb.064527
Results appear in:
Pataky, T., Robinson, M., & Vanrenterghem, J. (2015). Journal of Biomechanics. Journal of Biomechanics, 48(1), 190–192. http://doi.org/10.1016/j.jbiomech.2014.09.025
(Source code, png, hires.png, pdf)
One-way MANOVA
./spm1d/examples/stats1d/ex_manova1_Dorn2012.py
This example is the same as the CCA example immediately above, but treats the independent variable (running speed) as categorical instead of continuous.
Here the variable A is a (J x 1) vector of integers specifying the group to which each observation belongs.
>>> X2   = spm1d.stats.manova1(Y, A)
>>> X2i  = X2.inference(0.05)
>>> X2i.plot()
The data in this example come from:
Dorn, T. W., Schache, A. G., & Pandy, M. G. (2012). Muscular strategy shift in human running: dependence of running speed on hip and ankle muscle performance. Journal of Experimental Biology, 215(11), 1944–1956. http://doi.org/10.1242/jeb.064527
(Source code, png, hires.png, pdf)