Importing data
To conduct univariate spm1d analysis the data should be arranged as a (J x Q) array, where J is the number of 1D responses (i.e. trials or subjects) and Q is the number of nodes in the 1D continuum.
To conduct multivariate spm1d analysis the data should be arranged as a (J x Q X I) array, where I is the number of vector components in the 1D continuum.
Danger
spm1d no longer directly supports data importing.
Users are instead encouraged to use the following data importing tools (see examples below):
numpy.load
numpy.loadtxt
scipy.io.loadmat
Warning
WINDOWS USERS — File names in Python should be constructed using one of the following forms:
>>> fname = 'C:\\Temp\\MyData\\ex_kinematics.txt'
>>> import os
>>> fname = os.path.join('C:\Temp', 'MyData', 'ex_kinematics.txt')
Importing ASCII data
./spm1d/examples/io/ex_import_txt.py
If ASCII data are arranged in a (J x Q) tab-delimited array:
import os
import numpy as np
from matplotlib import pyplot
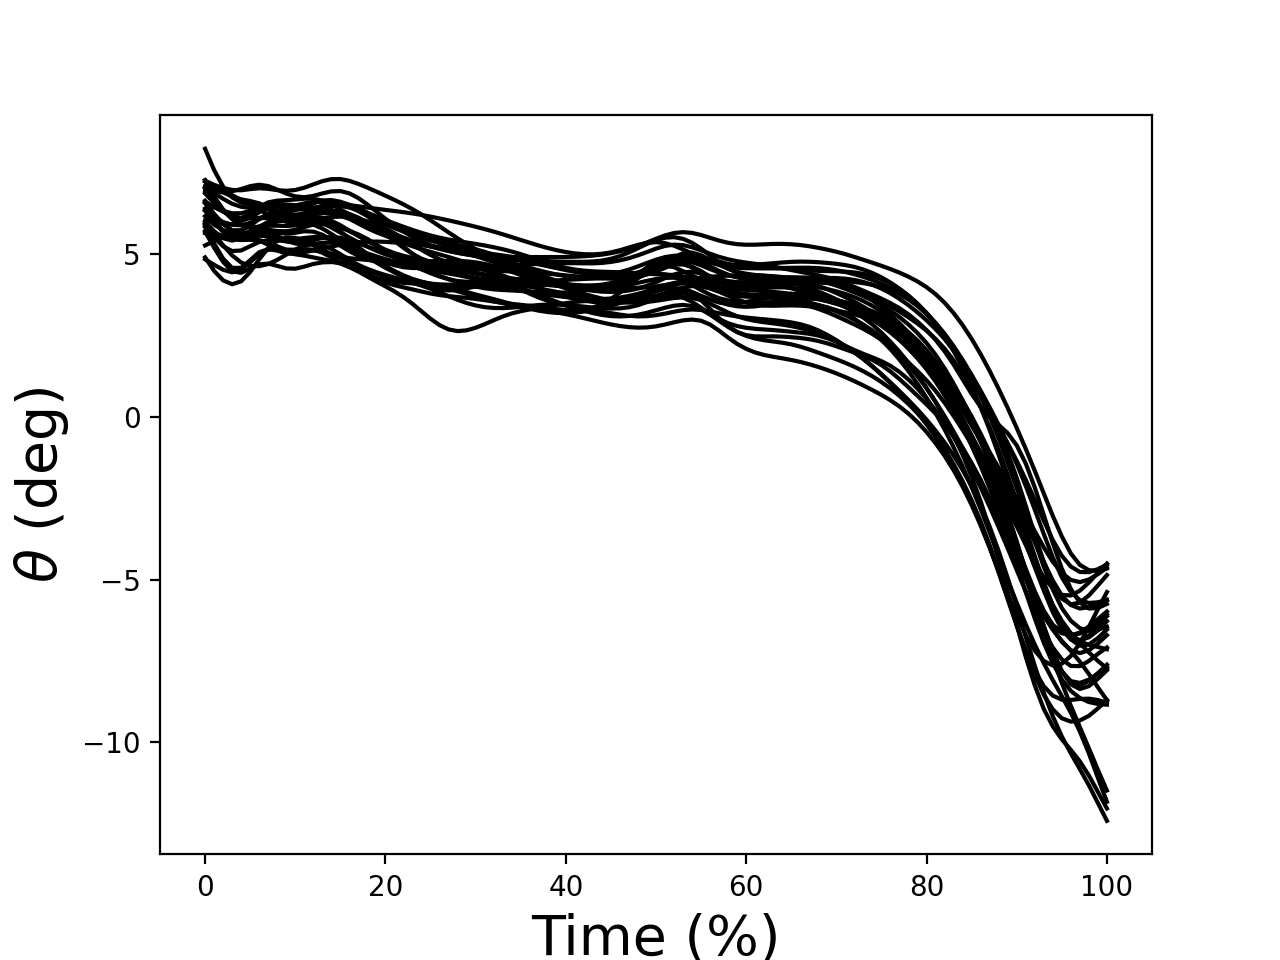
# load plain-text data (30 rows, 100 columns):
dir0 = os.path.dirname("__file__")
fname = os.path.join(dir0, 'data', 'ex_kinematics.txt')
Y = np.loadtxt(fname) #30 curves, 100 nodes
# plot:
pyplot.close('all')
pyplot.plot(Y.T, color = 'k')
pyplot.xlabel('Time (%)', size=20)
pyplot.ylabel(r'$\theta$ (deg)', size=20)
# pyplot.show()
(Source code, png, hires.png, pdf)

Importing MATLAB data
./spm1d/examples/io/ex_import_mat.py
MATLAB data files containing arbitrary variables can be imported as follows:
>>> from scipy.io import loadmat
>>> M = loadmat('myfile.mat')
>>> a = M['VariableA']
>>> b = M['VariableB']
>>> c = M['VariableC']
Example script:
import os
import scipy.io
from matplotlib import pyplot


# load Matlab data:
dir0         = os.path.dirname("__file__")
fname        = os.path.join(dir0, 'data', 'ex_kinematics.mat')
Y            = scipy.io.loadmat(fname)['Y']   #30 curves, 100 nodes

# plot:
pyplot.close('all')
pyplot.plot(Y.T, color = 'k')
pyplot.xlabel('Time (%)', size=20)
pyplot.ylabel(r'$\theta$ (deg)', size=20)
# pyplot.show()
(Source code, png, hires.png, pdf)

Importing HDF5 data (deprecated)
(HDF5 is no longer supported)