Test statistic field maxima
The basic procedure for RFT validations is outlined in Examples/Basic/Validating. This section presents code details for validating the probability with which test statistic field maxima survive particular thresholds.
See ./rft1d/examples/val_max_1_onesample_t_1d.py and other “val_max*.py” scripts
Validations for test statistic set-level and cluster-level inference are available in scripts titled ./rft1d/examples/val_upx*.py
Note
To see details of test statistic computation click on the “Source code” links above each figure.
Univariate
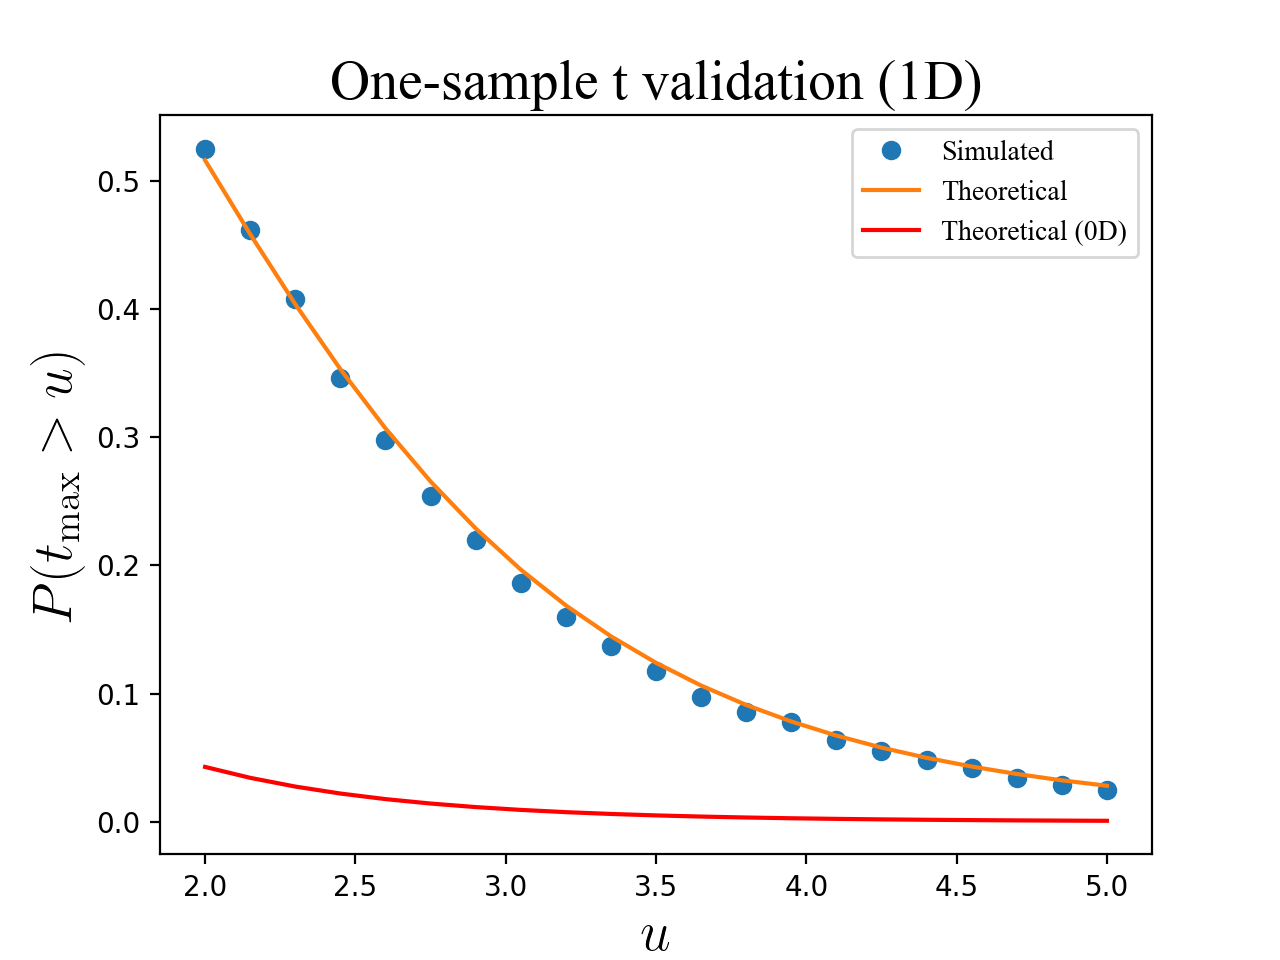
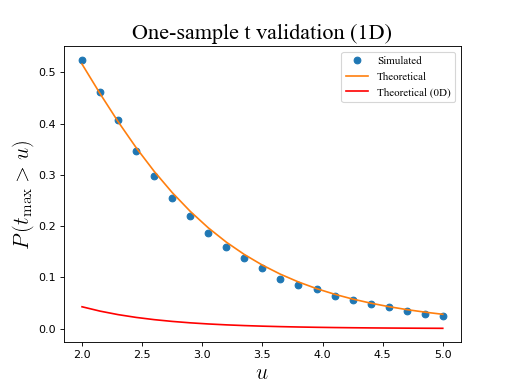
One-sample
(Source code, png, hires.png, pdf)
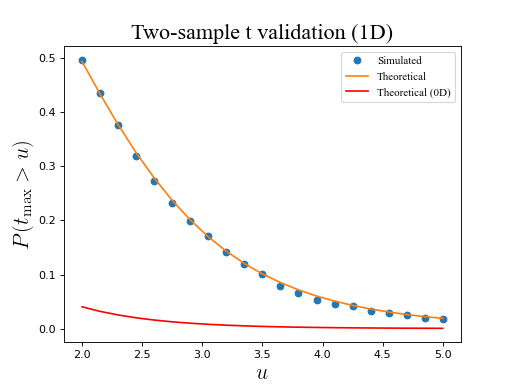
Two-sample
(Source code, png, hires.png, pdf)
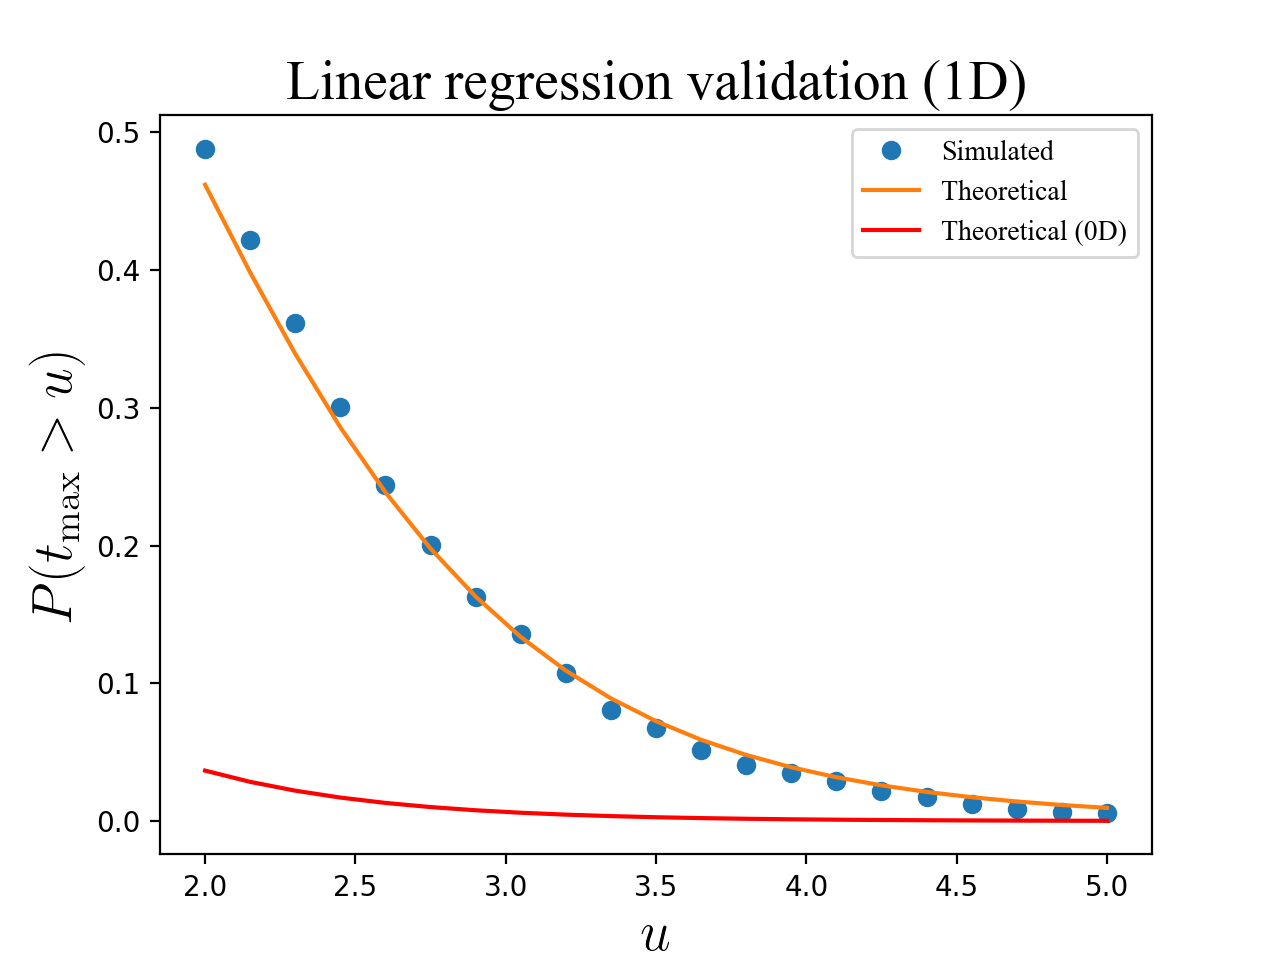
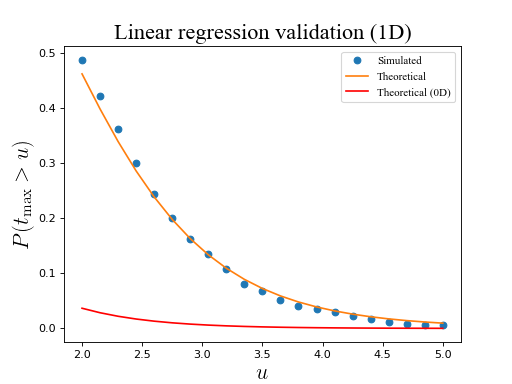
Regression
(Source code, png, hires.png, pdf)
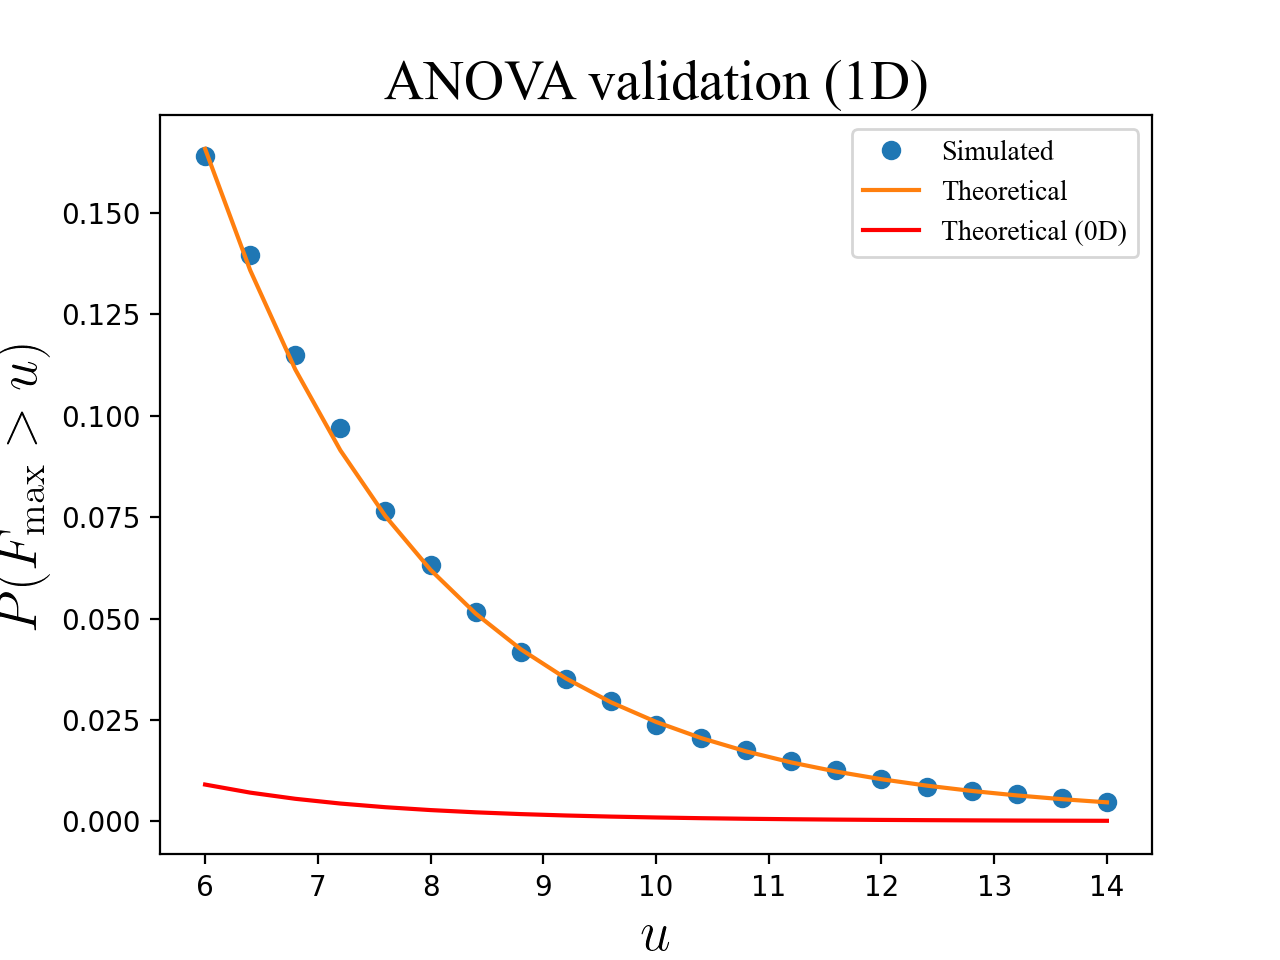
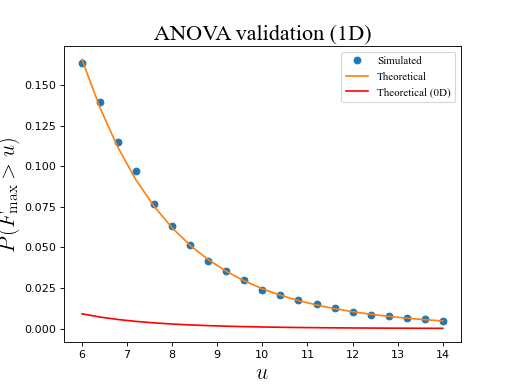
One-way ANOVA
(Source code, png, hires.png, pdf)
Multivariate
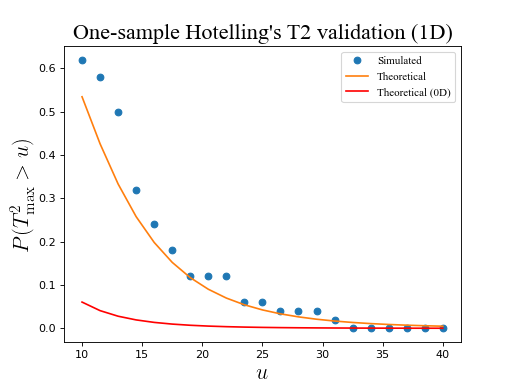
One-sample
(Source code, png, hires.png, pdf)

Note
Increasing the number of iterations will cause the results to converge to RFT expectations.
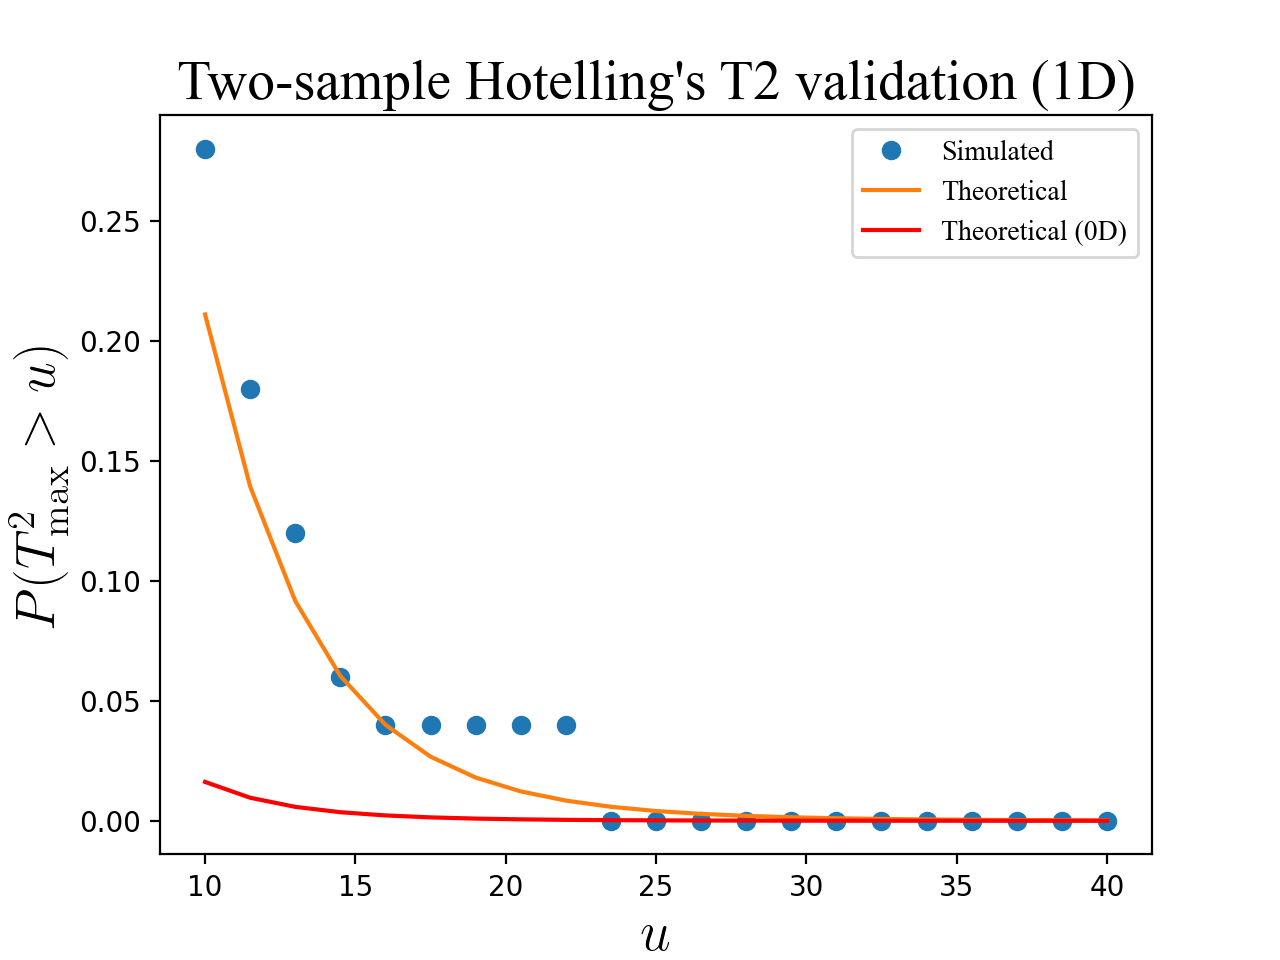
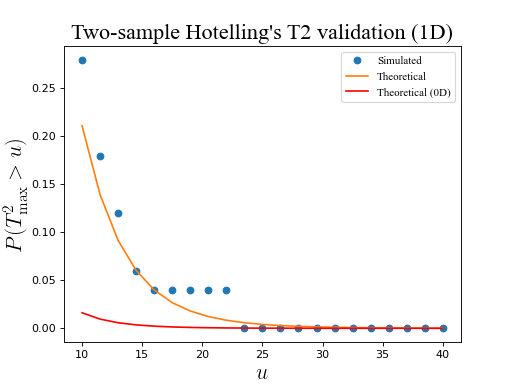
Two-sample
(Source code, png, hires.png, pdf)
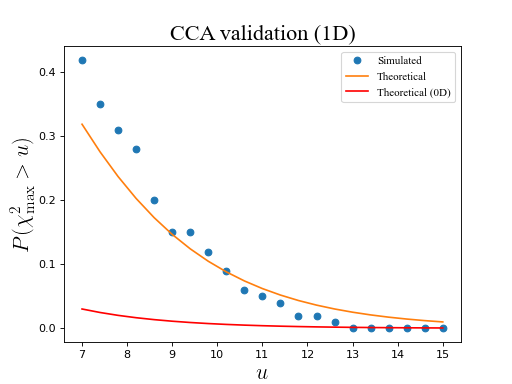
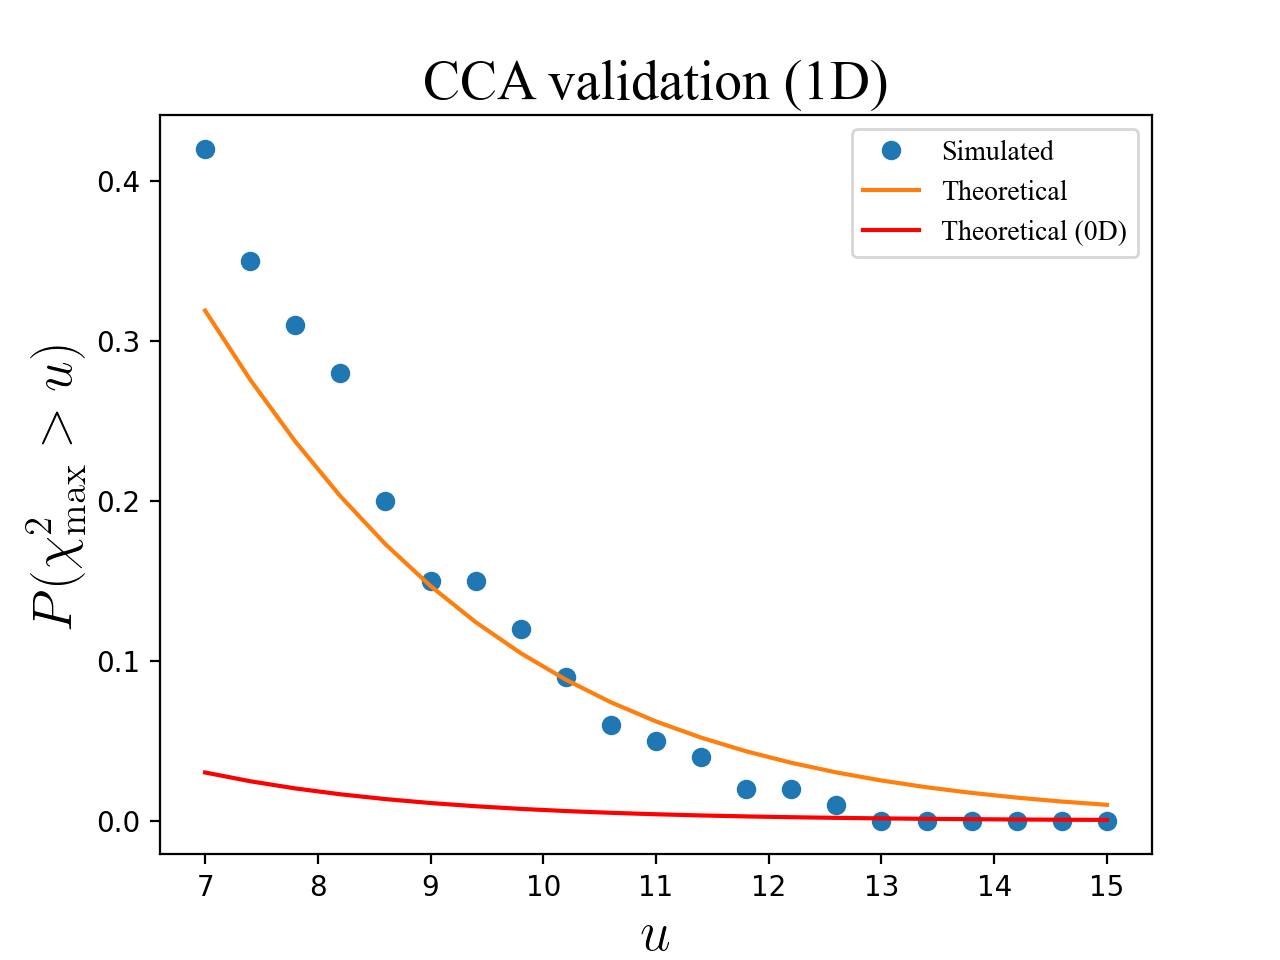
Canonical correlation analysis
(Source code, png, hires.png, pdf)

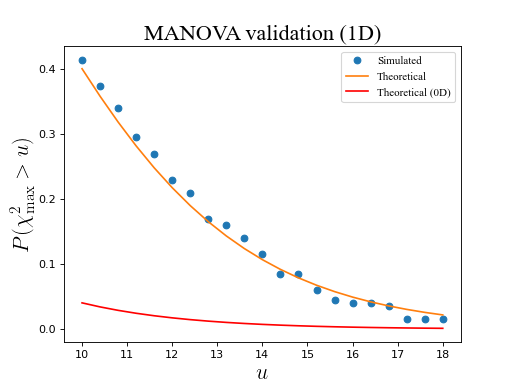
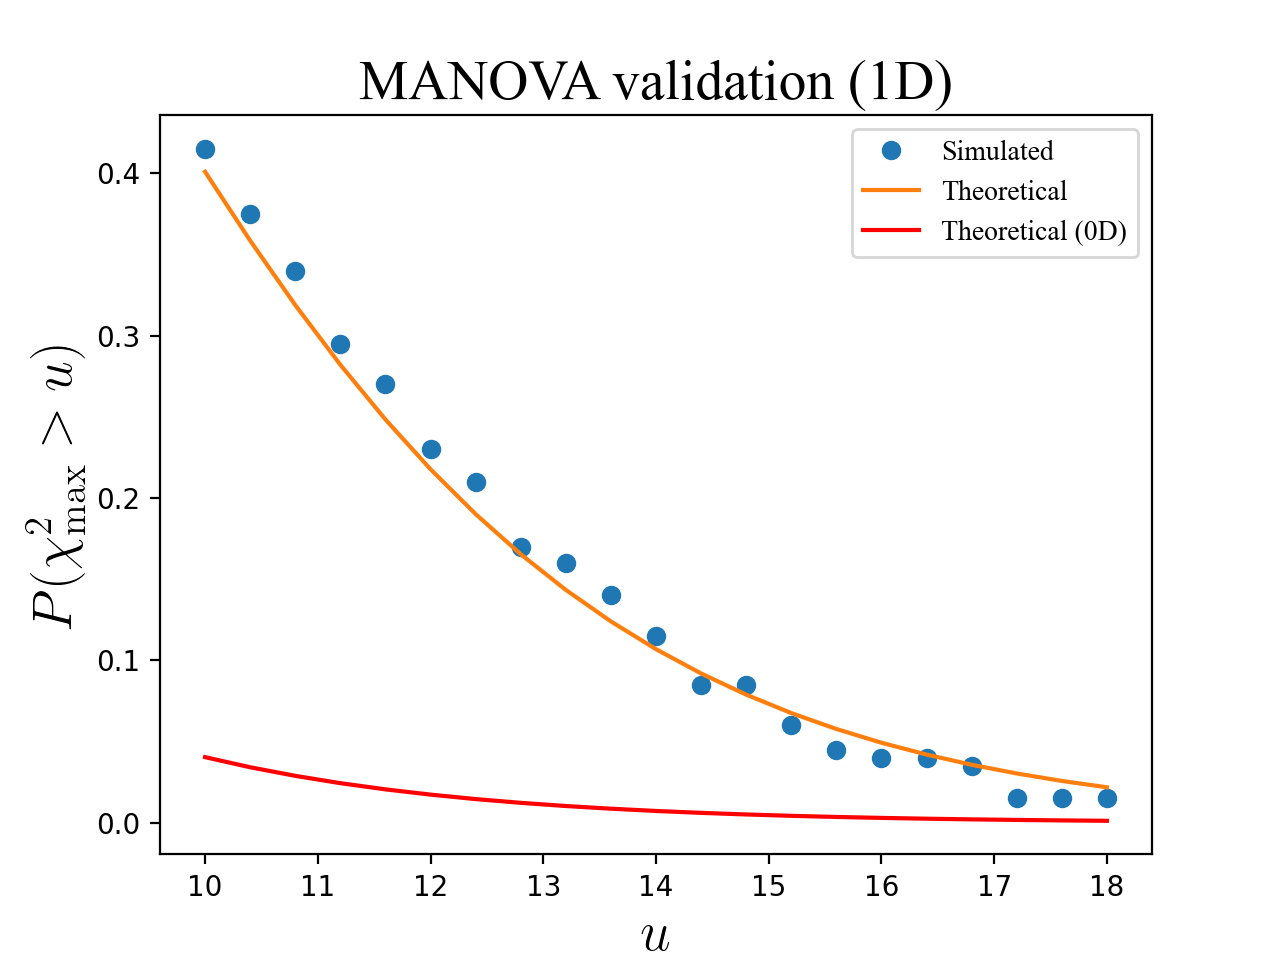
MANOVA
(Source code, png, hires.png, pdf)
