Conjugation analysis
The basic procedure for RFT validations is outlined in Examples/Basic/Validating This section presents code details for validating the probability with which multiple test statistic fields in conjunction will survive particular thresholds.
See ./rft1d/examples/val_conj_1_t.py
Conjunction validations for other test statistic fields are available in scripts titled ./rft1d/examples/val_conj*.py
import numpy as np
from matplotlib import pyplot
import rft1d
#(0) Set parameters:
np.random.seed(0)
nResponses = 12
nTestStatFields = 2
nNodes = 101
nIterations = 2000
FWHM = 10.0
### derived parameters:
df = nResponses-1
sqrtN = np.sqrt(nResponses)
### initialize RFT calculator:
rftcalc = rft1d.prob.RFTCalculator(STAT='T', df=(1,df), nodes=nNodes, FWHM=FWHM, n=nTestStatFields)
#(1) Generate Gaussian 1D fields, compute test stat:
generator = rft1d.random.Generator1D(nResponses, nNodes, FWHM)
Tmax = []
for i in range(nIterations):
T = []
for i in range(nTestStatFields):
y = generator.generate_sample()
t = y.mean(axis=0) / y.std(ddof=1, axis=0) * sqrtN
T.append( t )
Tconj = np.min(T, axis=0) #minimum across the test stat fields
Tmax.append( Tconj.max() )
Tmax = np.array(Tmax)
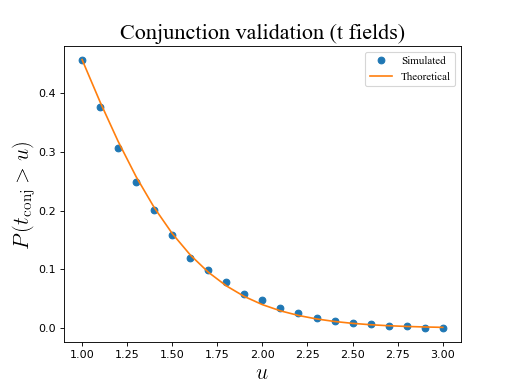
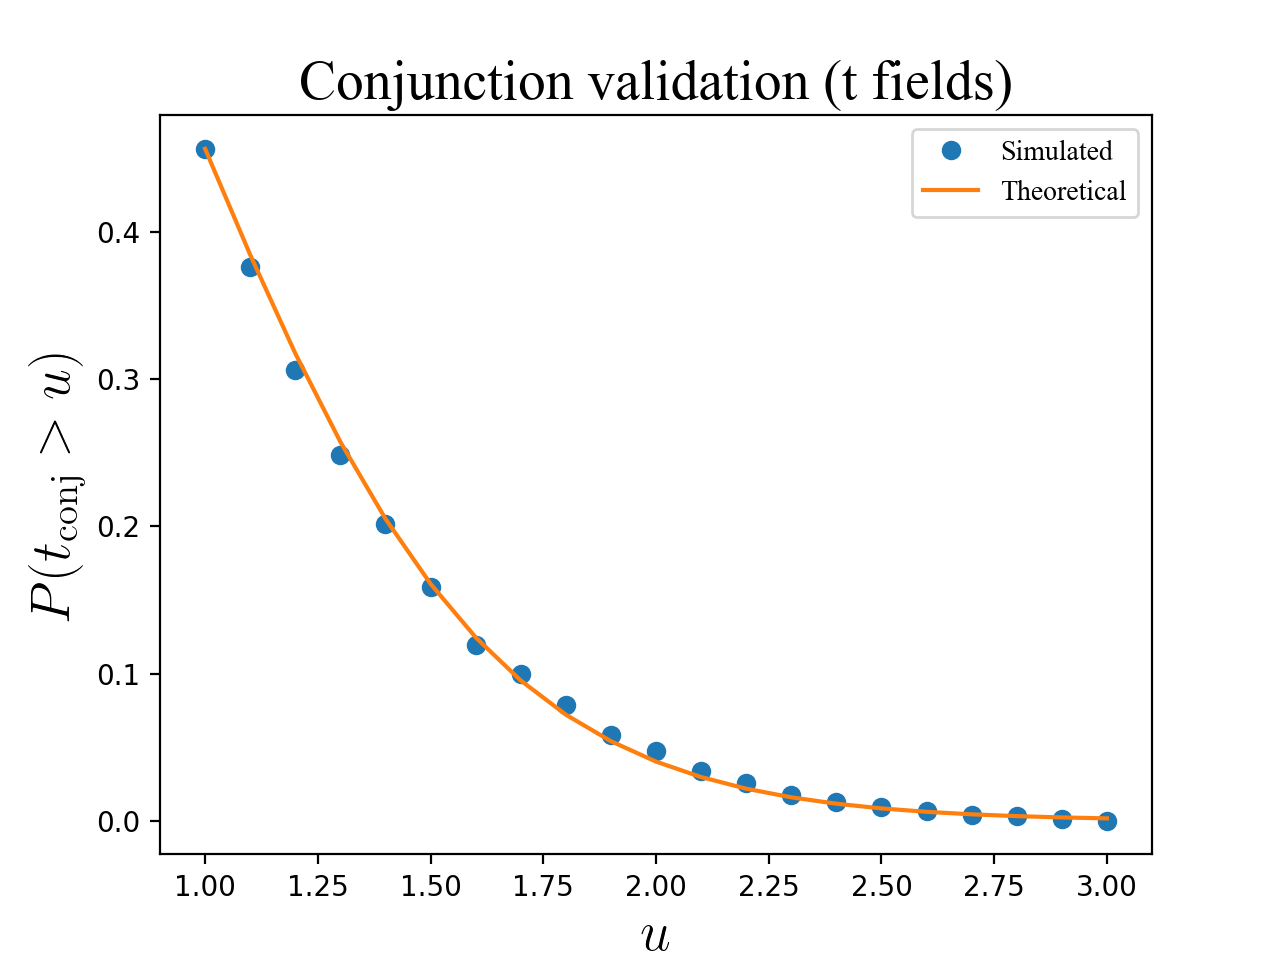
#(2) Survival functions:
heights = np.linspace(1, 3, 21)
sf = np.array( [ (Tmax>h).mean() for h in heights] )
sfE = rftcalc.sf(heights) #theoretical
#(3) Plot results:
pyplot.close('all')
ax = pyplot.axes()
ax.plot(heights, sf, 'o', label='Simulated')
ax.plot(heights, sfE, '-', label='Theoretical')
ax.set_xlabel('$u$', size=20)
ax.set_ylabel('$P(t_\mathrm{conj} > u)$', size=20)
ax.legend()
ax.set_title('Conjunction validation (t fields)', size=20)
pyplot.show()
(Source code, png, hires.png, pdf)