Field maxima (Gaussian)
The basic procedure for RFT validations is outlined in Examples/Basic/Validating This section presents code details for validating the probability with which Gaussian field maxima survive particular thresholds, also as a function of smoothness.
See also ./rft1d/examples/val_max_0_gaussian_1d.py
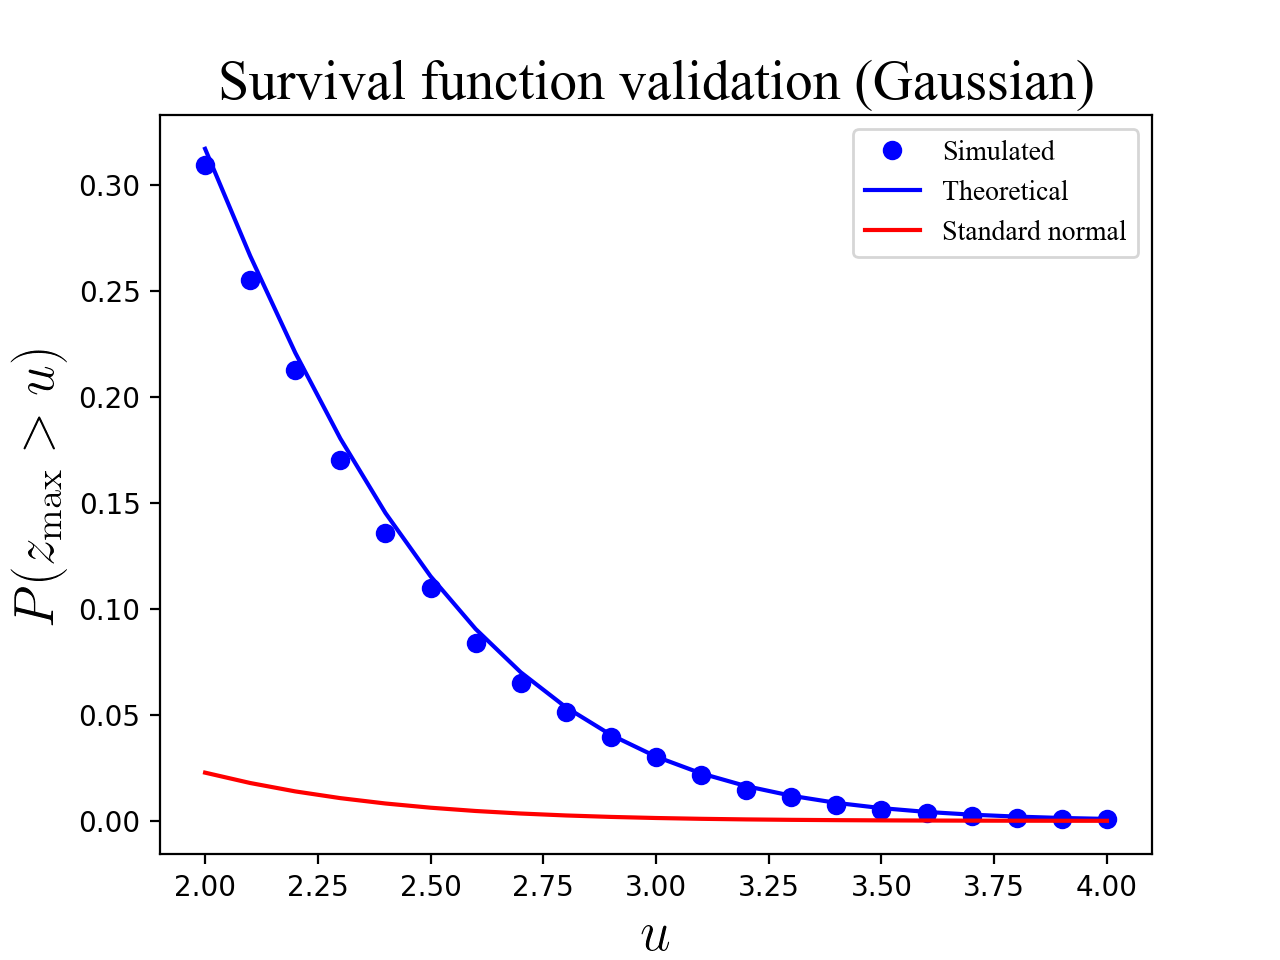
As a function of threshold height
import numpy as np
from matplotlib import pyplot
import rft1d

#(0) Set parameters:
np.random.seed(123456789)
nResponses = 10000
nNodes     = 101
FWHM       = 10.0

#(1) Generate Gaussian 1D fields and extract maxima:
y          = rft1d.randn1d(nResponses, nNodes, FWHM)
ymax       = y.max(axis=1)

#(2) Survival functions for field maximum:
heights    = np.linspace(2, 4, 21)
sf         = np.array(  [ (ymax>u).mean()  for u in heights]  )
sfE        = rft1d.norm.sf(heights, nNodes, FWHM)  #theoretical
sfN        = rft1d.norm.sf0d(heights) #theoretical (0D)

#(3) Plot results:
pyplot.close('all')
ax         = pyplot.axes()
ax.plot(heights, sf, 'bo', label='Simulated')
ax.plot(heights, sfE, 'b-', label='Theoretical')
ax.plot(heights, sfN, 'r-', label='Standard normal')
ax.set_xlabel('$u$', size=20)
ax.set_ylabel('$P (z_\mathrm{max} > u)$', size=20)
ax.legend()
ax.set_title('Survival function validation (Gaussian)', size=20)
pyplot.show()
(Source code, png, hires.png, pdf)

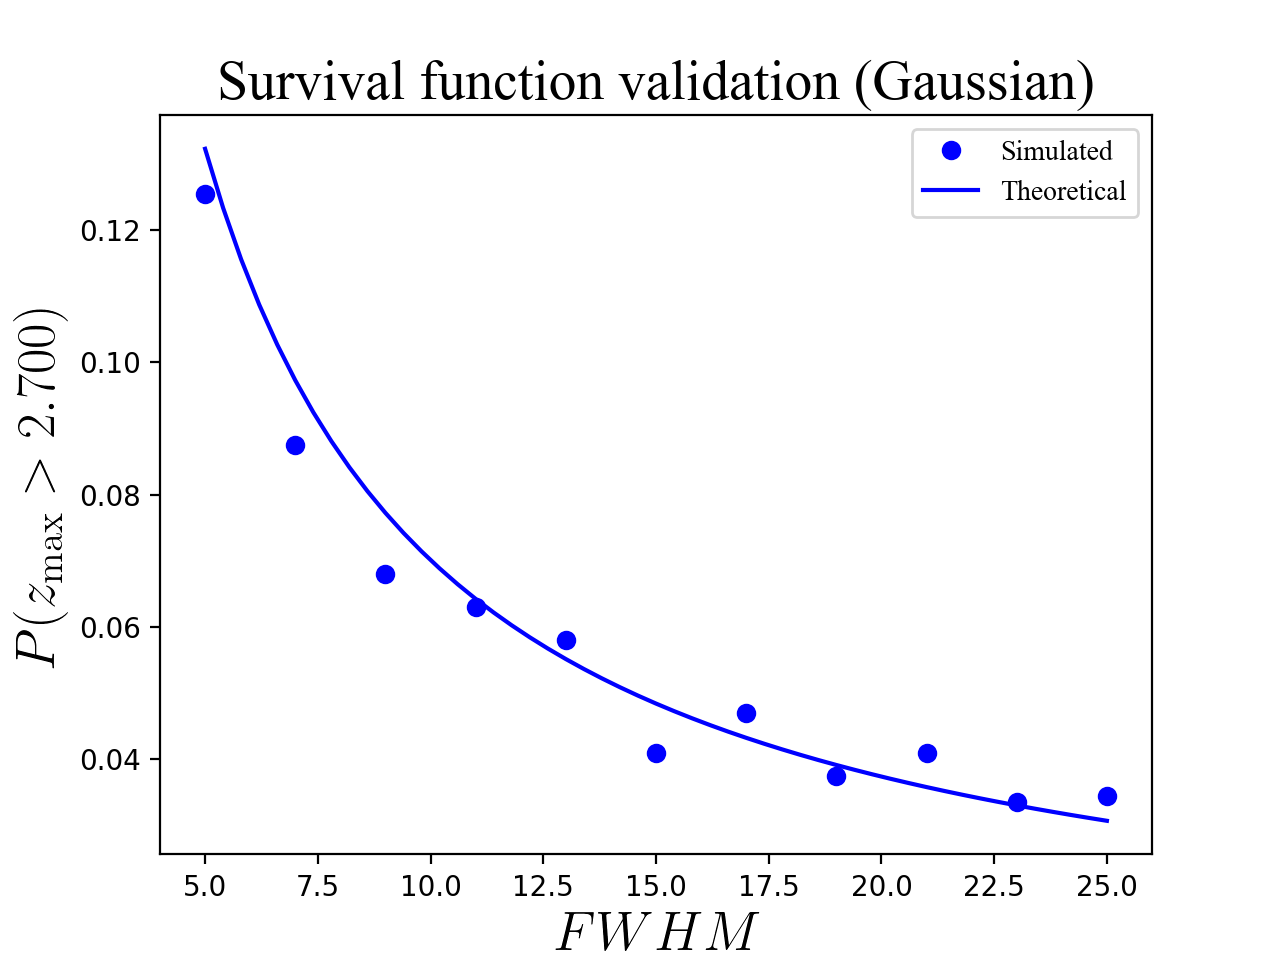
As a function of FWHM
import numpy as np
from matplotlib import pyplot
import rft1d

np.random.seed(123456789)
nResponses = 2000
nNodes     = 101
u          = 2.7
FWHM       = np.linspace(5, 25, 11)

#(1) Generate Gaussian 1D fields and extract maxima:
SF         = []
for w in FWHM:
        y      = rft1d.randn1d(nResponses, nNodes, w, pad=True)
        ymax   = y.max(axis=1)
        SF.append(  (ymax>u).mean()  )

#(2) Expected survival functions:
FWHMi      = np.linspace(min(FWHM), max(FWHM), 51)
sfE        = [rft1d.norm.sf(u, nNodes, w)  for w in FWHMi]

#(3) Plot results:
pyplot.close('all')
ax         = pyplot.axes()
ax.plot(FWHM, SF, 'bo', label='Simulated')
ax.plot(FWHMi, sfE, 'b-', label='Theoretical')
ax.set_xlabel('$FWHM$', size=20)
ax.set_ylabel('$P (z_\mathrm{max} > %.3f)$'%u, size=20)
ax.legend()
ax.set_title('Survival function validation (Gaussian)', size=20)
pyplot.show()
(Source code, png, hires.png, pdf)

Note
Tighter convergence can be obtained by increasing the number of fields (nResponses in the example above).