Test outputs
Outputs from statistical tests conducted in spm1d contain details which may be accessed in two ways:
Interactively using the print command
Programmatically using SPM object attributes
As examples let us revisit the one-sample t test.
(Source code, png, hires.png, pdf)
Raw SPMs
The single output of all statistical tests in spm1d.stats is a test statistic continuum (or SPM) object, which can be explored interactively using the print command:
>>> t  = spm1d.stats.ttest(Y)
>>> print( t )
SPM{t}
   SPM.z      :  (1x100) test stat field
   SPM.df     :  (1, 9)
   SPM.fwhm   :  11.21919
   SPM.resels :  (1, 8.82417)
Note
If you are in an interactive Python session, simply typing “t” and then ENTER should produce the same output.
The attributes of the SPM object include:
SPM{t} — a label indicating that this variable is a statistical parametric map, and that the test statistic is the t statistic. If we had conducted ANOVA, for example, then the variable would be labeled as “SPM{F}”.
SPM.z — the 1D test statistic continuum (or “test statistic field” or “test statistic trajectory”)
SPM.df — degrees of freedom
SPM.fwhm — the estimated full-width at half-maximum (FWHM) of a 1D Gaussian kernel which, when convolved with (random) 1D Gaussian continua, would yield the same smoothness as the observed residuals. The “residuals” are 1D continua embodying the variable that is not accounted for by the experimental design. In a one sample t test, for example, the residual for the j -th continuum is simply the difference between that continuum and the mean continuum:
>>>  j = 0
>>>  residual_j = Y[j] - Y.mean(axis=0)
SPM.resels — the resolution element counts, where “resolution element” refers to the geometric properties of the continuum. The first resel count is the Euler characteristic (EC), where EC is equal to one plus the number of “holes” in the continuum. The second resel count is (Q - EC) / FWHM, where Q is the number of continuum nodes. Thus the first resel count represents the number of separate “sections” in the continuum, and the second resel count represents the total number of independent “processes” in the continuum.
Each SPM{t} attribute can also be accessed programmatically, like this:
>>> x = t.fwhm
>>> print( x )
11.219185575045229
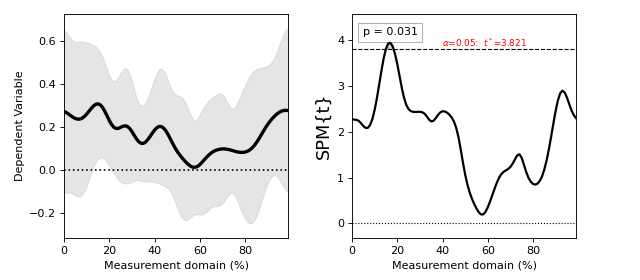
Inference SPMs
The output of the inference method is an inference continuum (or inference SPM) object:
>>> t  = spm1d.stats.ttest(Y)
>>> ti = t.inference(alpha=0.05)
>>> print( ti )
SPM{t}
   SPM.z        :  (1x100) test stat field
   SPM.df       :  (1, 9)
   SPM.fwhm     :  11.21919
   SPM.resels   :  (1, 8.82417)

Inference:
   SPM.alpha    :  0.050
   SPM.zstar    :  3.82411
   SPM.h0reject :  True
   SPM.p        :  (0.031)
The first four attributes are the same as in the raw SPM above. The final four attributes are introduced at the statistical inference stage.
SPM.alpha — the user-specified Type I error rate (default: 0.05)
SPM.zstar — the critical Random Field Theory threshold
h0reject — the null hypothesis rejection decision (i.e. does the test statistic continuum exceed zstar?)
SPM.p — a list of probability values, one for each threshold-surviving cluster. By definition each cluster’s probability value is equal to or less than alpha.
Note
In this example the p value is 0.031. This could be interpreted as follows: “the probability that smooth random 1D continua would produce a suprathreshold cluster as broad or broader than the observed cluster is 0.031”.
Danger
Do not misinterpret probability values as descriptors of experimental data.
They instead describe the random behavior of smooth Gaussian 1D continua.
Cluster-specific probability values depend on five parameters:
Type of test statistic
Sample size (i.e. degrees of freedom)
Resel counts (i.e. continuum size relative to its smoothness)
The cluster’s minimum suprathreshold height
The cluster’s breadth relative to the continuum size.
Suprathreshold clusters
All inference SPM objects have an attribute called “clusters” which contains a list of cluster objects.
>>> t  = spm1d.stats.ttest(Y)
>>> ti = t.inference(alpha=0.05)
>>> print( ti.clusters )
[Cluster at location: (17.000, 3.870)
   extent          :  3
   extent (resels) :  0.26740
   height (min)    :  3.86630
   P               :  0.03102
]
Note
If multiple clusters exist, they will be listed in the following order: (1) upper threshold left-to-right, (2) lower threshold left-to-right.
Warning
If the test fails to reach the critical threshold, clusters will be an empty list: “[ ]”.
You can access specific clusters using list indexing:
>>> cluster0 = ti.clusters[0]
>>> print( cluster0 )
Cluster at location: (17.000, 3.870)
   extent          :  3
   extent (resels) :  0.26740
   height (min)    :  3.86630
   P               :  0.03102
Cluster attributes include:
cluster.xy — the cluster centroid coordinates. Here the centroid is located at (17.000, 3.870).
cluster.extent — the number of continuum nodes in this cluster which exceed the threshold.
cluster.extentR — the same as cluster.extent, but expressed in resel units.
cluster.h — the minimum height of all cluster nodes.
cluster.P — the probability that smooth, random 1D continua would produce a suprathreshold cluster with the observed breadth